

EV repair costs keep falling in Q2 as market matures
Produced by Activate Group in collaboration with Gecko Risk.
Headlines
- EV repair costs fell 1.9% year-on-year in Q2 as the repair ecosystem matures
- Parts costs down 3.6% year-on-year, having fallen for two consecutive quarters
- Tesla reasserted its dominance over the EV market with 15K+ registrations
Introduction
Welcome to the latest edition of the quarterly Charge Up report from Activate Group, the leading collision management business, and Gecko Risk, specialists in EV data and analytics. This report provides regular insight into the evolving landscape of electric car adoption, repair and risk across the UK.
Repair costs continue to ease this quarter, even as registrations climb and the competitive picture between new market entrants and established UK manufacturers keeps shifting.
EV Registrations
The UK registered 146,965 new EV cars in Q2 2026, continuing the growth seen in Q1, when 137,614 EV cars were registered.
Tesla reasserted its dominance over the quarter, with more than 15,000 registrations, and the Model Y and Model 3 took the two top-selling spots. June marked Tesla’s highest monthly registration total since December 2022.
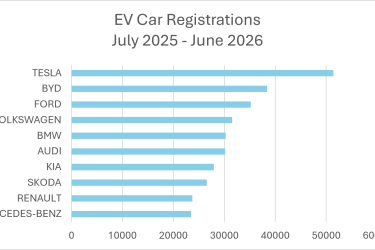
Over the last 12 months, Tesla has remained the highest-selling EV manufacturer in the UK, with BYD now firmly established in second place on almost 40,000 registrations.
James Fisher, Managing Director, Gecko Risk said: “BYD achieving the second-highest number of EV car registrations over the last 12 months is an extraordinary success story for the manufacturer.
“It has taken Chinese brands like BYD and JAECOO less than five years to reach a level of market recognition and maturity that took Korean brands like Kia around 15 years of steady growth to achieve in the UK.”
Repair costs
EV repair costs continued their downward trend in Q2 – down 1.9% year-on-year.
This is partly being driven by growing maturity in the EV repair ecosystem, with repairers now better equipped to manage EV repairs and improved parts infrastructure in place. A changing EV mix is also playing a part, with more affordable vehicles entering the market and bringing down the overall average.
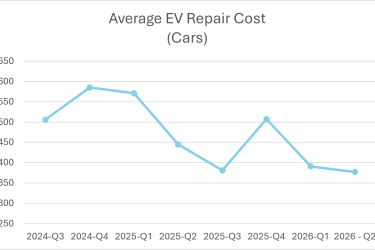
Average labour costs have been trending down gradually since September 2024, though they stabilised this month. Average parts costs are also down, having fallen for the past two consecutive quarters and are now down 3.6% year-on-year.
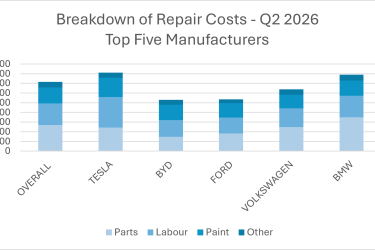
A comparison by manufacturer for Q2 shows that Tesla is still the most expensive to repair of our top five EV car manufacturers as a result of higher than average labour costs, while average repair costs for BYD and Ford are significantly below the average for EVs in general.
Chris Aplin, Head of Network Operations & Engineering, Activate Collision Solutions said: “Repairers are clearly becoming better equipped to deal with both electric cars and an influx of new manufacturers.
“As with all ADAS-equipped vehicles, parts costs remain relatively high. Interestingly, new entrants to the UK market and EV specialists like Tesla and BYD appear to be keeping tighter control of their own parts supply, holding costs at a much lower level than more established brands. For insurers and fleets, this different approach is a genuine differentiator in calculating total cost of risk.”
Accident Frequency*
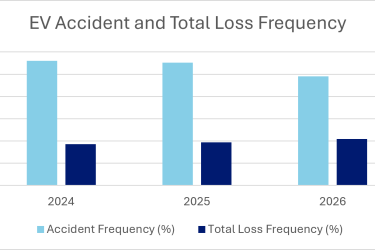
EV total loss frequency has remained stable for the last three years at an average of 4%. Meanwhile accident frequency hows a slowly improving picture – down slightly year-on-year from 11-10%.
Conclusion
Record registrations in Q2 2026 demonstrate strong consumer appetite, yet the sector is still behind the pace required to meet regulatory targets.
Repair costs appear to be falling as the industry gains experience, though the underlying cost structure continues to evolve differently across manufacturers – a factor insurers and fleets will need to keep factoring into total cost of ownership and claims pricing.
As the market matures, the claims industry will need to keep adapting to a more complex landscape shaped by shifting consumer profiles, new entrants, and changing repair economics.
*Accident frequency data is based on annualised monthly accidents / vehicles on road, total loss rates are calculated as total loss / total accidents